Zen and the art of HPEC software debugging
StorySeptember 18, 2017

Tammy Carter
Curtiss-Wright

The age-old debate regarding art versus science: Some engineers take a romantic approach, while others take a more traditional approach. Whether debugging is an art or a science or a combination of both will continue to be debated, but all sides can agree the tools can make all the difference between timely success and riding a metaphorical motorcycle down the road of failure.
The author of the classic novel “Zen and the Art of Motorcycle Maintenance,” Robert L. Pirsig, passed away in April 2017. His book, first published in 1974, has inspired many readers with its interweaving of serious philosophical explorations into the tale of a father and son coming to understand each other during a motorcycle road trip across the U.S. The ideas in Pirsig’s writing could encourage a view of software debugging that integrates art and science, so that the high-performance embedded computing (HPEC) system developer can successfully tap both process and imagination to solve daunting everyday problems.
There has always been a debate about whether software debugging is an art or a science. Some engineers take the romantic approach to software integration: they write the code and debug by inspiration and intuition. Living in the moment, they forgo rational analysis or repeatable processes. When confronted with an issue, they follow their gut instincts and change their code, often without even making a backup in case their assumption was wrong. They doggedly stack patches on top of patches, or introduce more problems when trying to back the changes out later.
Taking a different tack, some software developers follow the traditional approach to debugging: they try to diagnose and solve the problem by rigidly following a step-by-step scientific methodology. This makes them frustrated when the real world does not function the same as the world described in the programming books. Because of their dedication to ritual, technology threatens to transform into magic, becoming unpredictable and time consuming. The traditional developer will try the same techniques over and over again, vainly hoping for a different result.
Perhaps the best programmer is one that embraces debugging as both an art and a science. This approach takes the best from both worlds, enabling bursts of creativity and intuition to work in harmony with rational problem-solving debugging skills while using debugging tools.
The three categories of software bugs
Most software bugs encountered in the development of HPEC programs fall into three broad categories: The first type is straightforward and repeatable; due to its nature, this type of bug is the easiest to find and to fix.
The next type of bug plays catch-me-if-you-can, and hides when you try to trap it. For example, every developer has tried to debug a problem by putting in “just a couple of ‘print’ statements,” and amazingly the code starts working. After a few more ‘print’ statements are added the problem re-emerges, but dressed in totally different symptoms.
The third type of bug is the monster that haunts our nightmares, the one of such complexity and obscurity that it appears to be truly random and doesn’t follow any discernable pattern. It might, for example, only happen once a week after you run mode A and then mode B for a thousand times in a complex sequence, and only when the moon is full and you have left to get a drink and a slice of cold pizza.
All these bugs create a range of problems. They can cause dismal failure, incorrect results, or a hard crash; they could even cause the program to get lost in the weeds. To make matters worse, the error is usually not where the failure is observed; a large part of the debugging detective work is tracing the error back to the root cause. Adding to the complexity, parallel programs’ bugs can and will propagate across multiple threads, as well as multiple processors. If all of that is not enough, the bugs can also be timing-dependent.
As Pirsig observed, “Some things you miss because they’re so tiny you overlook them. But some things you don’t see because they’re so huge.” When debugging, some basic scientific tenets must be observed. One must always use a logbook to track what has been tried. Nothing is more frustrating than seeing a similar problem to one that has already been fixed, but not remembering how it was solved. Keeping a paper logbook is a great first step, but you still have to keep track of the logbook itself!
Fixing software with software
Users can call upon a debugger such as Allinea DDT, which provides a digital logbook that automatically records the entire debugging session and preserves the records of their scientific inquiry. For each stop in the program’s execution, the reason and location is recoded along with the parallel stacks, variables, and tracepoints, which is a scalable “print” alternative. The only exercise left for the user is recording the hypothesis, noting the resulting observations, and then concluding using the annotation option. The formation of the hypothesis is part of the art of debugging. As Pirsig opined, “For every fact, there is an infinity of hypothesis.”
Combining art and science for segment faults
Let’s examine the straightforward problems that happen repeatedly, such as segment faults, aborts, or an exit without an error code, along with the tool features that can facilitate solving these problems. These common bugs are easy to fix with a debugger, a task that is much harder and time-consuming without one. The static-analysis tool will flag common mistakes when the user opens the code with Allinea DDT. An example of the type of errors flagged is shown in Figure 1.
Figure 1: Types of errors flagged with Allinea DDT.
|
|

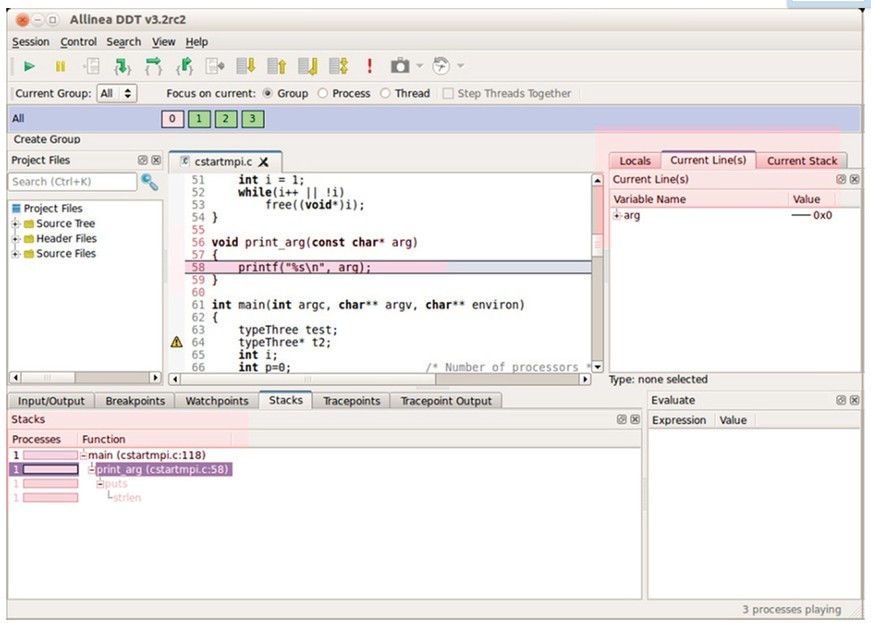
To become familiar with the tool, let’s look at a simple program that aborts when it runs with input arguments. As seen in Figure 2, the debugger stopped on the line where the error was detected. The “Stacks” view pane shows the function call tree to the point where the code was stopped. Looking at the “Variable” pane reveals “arg = 0,” which is the problem. Most times, the answer will still not be obvious; one might be tempted to sprinkle some “print” statements, which would require the code to be recompiled.
Figure 2: The debugger stops on the lie where the error is detected.
|
|
Tracepoints are a superior option because they track the lines of code executing and the variables of interest without stopping execution across multi-processes. Visual line indicators, called “sparklines,” quickly show the variation of the values across the processes and the range of the values as shown in Figure 3.
Figure 3: For even more detail, the “Cross-Process and Cross-Thread Comparisons View” will present the data as a raw comparison, statistically or graphically.
|
|

One could explore arrays using the previously described tools, but that could be painful, slow, and confusing for large arrays. The Allinea debugger also has a tool for analysis of arrays, complete with graphing and export capabilities. Complementing all the options the tool provides to analyze the data are flow-control features such as breakpoints, watchpoints, and step features add to the debugger’s arsenal for proving hypotheses without ever having to change a line of code. A watchpoint is a variable or expression monitored by the debugger, such that when it is changed or accessed, the debugger pauses the application. One could say that the science is in the tools, while the art springs from the wielding of these tools.
Remembering the tricks for memory errors
The next family of errors are memory errors, which can be very painful to track down. Depending on the input data, the problem might not be triggered or the results will be incorrect with subtle, easy-to-miss differences.
Overwriting or reading past memory boundaries can cause crashes or errors that don’t occur until much later in the execution. Add to this the potential problems of deallocating memory multiple times, pointers to the wrong address, and all-too-common null pointers. The Allinea tool provides options to dial in the just the right amount of memory help. The more in-depth levels require more memory and time.
Figure 4: Basic memory check traps a memory overwrite.
|
|

Figure 4 shows an example when a basic memory check traps a memory overwrite. By selecting the pause button, the debugger will stop with the offending line of code highlighted, then variables, pointer details, and expressions can all be evaluated as previously described. Given the art of the developer, these insights might be enough to reach a logical conclusion. If not, guard pages come to the rescue to check for read and writes beyond an allocated block. The pages can be added before or after the block, and the default of a single page catches most errors. When memory usage is growing faster than expected due to a dreaded memory leak, the currently allocated memory for selected processes can be tracked with the “Current Memory Usage” view as shown in Figure 5.
Figure 5: Current memory usage view.
|
|
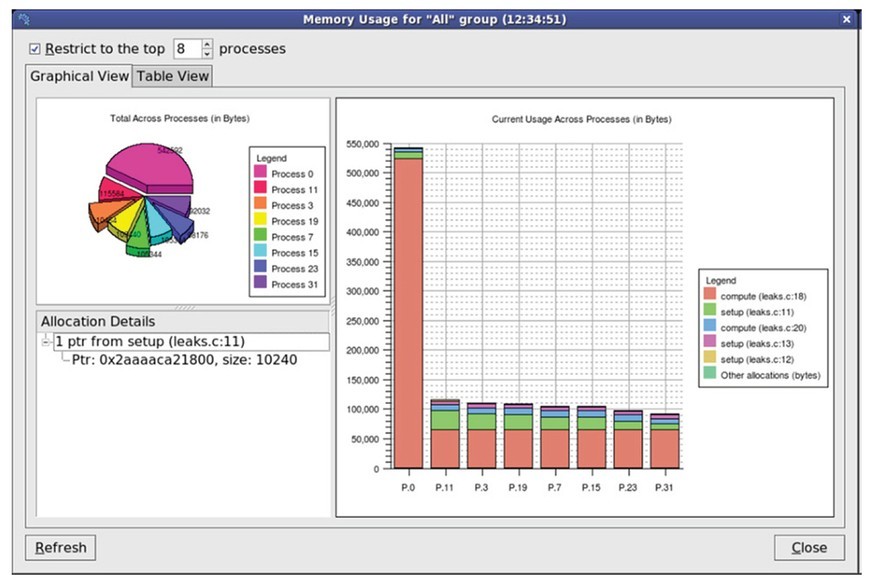
The pie chart presents a quick overview of total memory allocated for each process. In the stacked bar chart, each bar represents a process, and that bar is broken down into colored blocks for the contained functions. To drill down even further, clicking on a color block will provide detailed information about the memory allocations inside that function. Digging deeper still, the developer can enter the “Pointer Details View” to see exactly where the pointer was allocated, de-allocated, and the amount of memory allocated. One might wonder why complex tools like this debugger are needed. Pirsig – our “Zen” author – supplies the answer: “What makes this world so hard to see clearly is not its strangeness but its usualness. Familiarity can blind you too.”
Solving the sleepless-night dilemma
Let’s shift to the chaotic nonrepeatable bugs. These are the ones that lead to lost sleep, long weekends in the lab, and endless cups of cold coffee or warm Mountain Dew. The tracepoint tool can be configured to capture only unexpected values or to search for interesting patterns. Here, the art requires imagination.
For example, use this feature to capture variables to determine why a function is called numerous times, but crashes only occasionally (usually when you walk away from the computer for a minute!). In addition to the interactive mode described earlier, the Allinea tool also has an offline debugging mode in which the debugger directs both the running of the code and the storing of results without user intervention. This mode enables the system to collect data overnight, or however long it takes for the problem to occur. This offline mode supports a full set of tools such as tracepoints, memory debugging aids, and even breakpoints. In this mode, the debugger can also compile snapshots of the program state including the stacks and selected variables. The snapshots can be triggered periodically or by sending a signal from another terminal window to the front-end process.
The final report produced by the offline session consists of four sections: messages, tracepoints, memory-leak status, and the output complete with time stamps.
Another tool that aids in the hunt for elusive bugs is checkpointing. A program’s entire or partial subset can be stored in memory as a checkpoint for the duration of the debugging session. The application’s state can then be restored from the saved checkpoint; execution then resumes from the restore point. This feature is useful when the user is unsure of what data will be needed to diagnose the problem until it is too late to retrieve it, and it is difficult to get back to this point in the execution. For example, the program crashes because a variable has been set to an unexpected value and it is too late to set a watchpoint on that variable. If the engineer had the artful insight to set a checkpoint earlier, the program can be restored to the checkpoint where the watchpoint can be set and the failure re-analyzed.
When hunting for those elusive bugs, this quote from Pirsig may resonate: “You look at where you’re going and where you are and it never makes sense, but then you look back at where you’ve been and a pattern seems to emerge.”
Taking the wheel
This whirlwind tour of the art and science of debugging for HPEC systems is intended to illustrate how debugging tools are expanding the ability to produce quality and more robust software with far less effort.
Tammy Carter is the senior product manager for OpenHPEC products for Curtiss-Wright Defense Solutions, based out of Ashburn, Virginia. She has more than 20 years of experience in designing, developing, and integrating real-time embedded systems in the defense, communications, and medical arenas. She holds a Master of Science in Computer Science from the University of Central Florida. Readers may reach the author at tcarter@curtisswright.com.
Curtiss-Wright Defense Solutions www.curtisswrightds.com