Turbocharge HPEC system design with HPC development tools
StoryJuly 25, 2016

Tammy Carter
Curtiss-Wright

As parallel programming grows in importance and popularity, the critical challenge has become how to intelligently manage, develop, and debug the increasingly complex code. Traditional tools such as trace analysis, serial debuggers, and the venerable "printf"statement just aren't up to the task. Although some commercial off-the-shelf (COTS) vendors and customers in the embedded-defense space have attempted to develop their own parallel programming tools, the task has proved difficult and the resulting tools are far from full-featured. What's more, using proprietary development tools can add risk to a program's cost and schedule. The good news: A better source of tools for designing cutting-edge high-performance embedded computing (HPEC) systems already exists in an adjacent market - the commercial high-performance computing (HPC) market. Sourcing proven and powerful tools from the HPC community, long supported by an expansive user base, can greatly speed delivery time while decreasing costs and program risk.
The largest cost of developing a HPEC system for aerospace and defense applications is not the hardware, but rather the software. Research consistently shows at least 50 percent of programming time is typically spent debugging. The right tools can make all the difference. Using a comprehensive system debugger can help slash development time, reduce schedule creep, and eliminate cost overruns. Profilers can also be of great utility for HPEC system development because they help optimize and benchmark code and can perform regression testing. Another important tool for HPEC development is a cluster manager to help organize all of the nodes in the system. Taken together, debuggers, profilers, and cluster managers have become critical tools for creating a fully tested, validated, and benchmarked HPEC development environment.
The importance of these development tools has greatly increased in parallel with the availability of the latest generation of multicore central processing units (CPUs), graphics-processing units (GPUs), and field-programmable gate arrays (FPGAs). As the newest generation of devices has become the building blocks of choice for demanding embedded intelligence, surveillance, and reconnaissance (ISR) systems, the process of developing and debugging these systems has also become increasingly more complicated. This situation occurs because system designers tasked with taking full advantage of the processing power of next-generation devices to develop embedded HPEC “supercomputers” have found that their code must be executed in parallel across many nodes. High-speed serial coding techniques have proved inefficient when compared to programming the multiple independent and concurrent activities required to process the complex algorithms typically used in the radar, image, and signal processing jobs that HPEC systems perform.
HPC tools to the rescue
Over the past decade, the HPC market has evolved a mature and feature-rich set of software development tools that include math libraries, communications APIs, testing tools, and cluster managers. What makes these resources so appealing for the COTS market is the fact that the supercomputers used in commercial HPC applications, such as ultra-high-speed financial transactions and weather simulation, are built with the same hardware building blocks (processors, general processing units (GPUs), and fabrics) now used in the HPEC world. For example, the University of Texas’s Stampede supercomputer is built with Intel Xeon processors and NVIDIA Tesla GPUs, also fundamental components of military HPEC systems. Commercial and military supercomputer system developers face many of the same concerns, including floating-point performance, throughput, latency, and a preference for standard software APIs.
For the HPEC system developer, cluster managers, debuggers, and profilers are the software equivalent of an oscilloscope, spectrum analyzer, and logic/network analyzer. As critical as the latter are for hardware development, these software tools are equally important for developing today’s complex parallel HPEC systems.
Cluster managers handle system configuration
An HPC cluster manager saves time and money by easing the setup and maintenance of the system configuration. It also eases the strain on developer resources and scheduling by providing a simple method for sharing the lab-development system. Later, during the production phase, the cluster manager helps ensure quality and customer satisfaction by enabling exact duplication of the software images. A cluster-management system provides all the tools needed to build, manage, operate, and maintain a cluster in an HPEC system.
An example of a leading cluster manager, well-proven in the HPC market, is Bright Computing’s Bright Cluster Manager. Using an intelligent cluster-management installation tool like Bright Cluster Manager for HPC enables the cluster to be installed, from bare boards to a full development system, in a matter of minutes. It can configure all of the system resources such as custom kernels, disks, and networks. Since the cluster manager supports image-based provisioning, kernel images can be maintained for different board types in the system, including GPUs, which makes adding, deleting, or moving a board to another slot as simple as a mouse-click.
Cluster managers also support developers loading their own kernel images to a single board or a combination of boards. This ability enables multiple developers to work on separate groups of processors on the system – a limited resource – simultaneously. The separate kernel images allow the developers to always start their work session at a known point, eliminating any doubt regarding the state the system was left in by a previous user. This image-based provisioning architecture can also guarantee that the same version(s) of software is loaded on all the boards, of all processing types, for full system testing and delivery, thereby eliminating the headache of reprogramming boards. The revision control also empowers the user to track changes to the software images using standardized methods, and effortlessly roll nodes back to a previous revision if needed.
The health and monitoring features – including temperature, CPU loading, and disk space – in the cluster manager provide a visual status of the entire system. It also logs and displays the boot-up messages for all of the boards and conveys any errors or warnings from the system logs. This feature removes the need to connect a terminal to serial ports to debug and configure the compute nodes, saving time that may have been spent searching for the right serial cable, a serial-to-USB adapter, or the driver for the adapter (especially if the user is on a network that can’t access the outside world). This total management of the system supports the complete life cycle, enabling a seamless transition from lab development to flight readiness through manufacturing and delivery.
Debugger and profiler
Use of a high-end debugger and profiler sourced from the HPC community enables bugs to be addressed in a much more timely and efficient manner. An example of a leading solution, used by more than 70 percent of the world’s supercomputers and taught in universities worldwide, is the Allinea Forge tool suite, which combines Allinea Software’s debugger DDT and a profiler, MAP. Forge combines debugging, profiling, editing, and building – including integrated version control – with all the tools sharing the same easy-to-use interface.
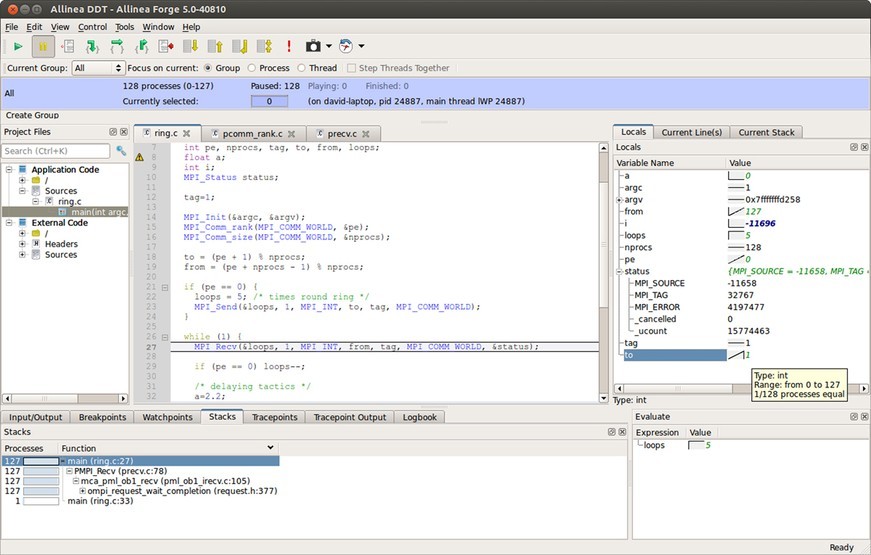
Debuggers with advanced capabilities, like Allinea DDT, help developers quickly discover the root causes of software defects, such as an uninitialized variable. Without the debugger, weeks or months of effort might be spent trying to solve the same problem in a deployed system. Unlike other debuggers, DDT visualizes data across multiple processes, enabling developers to quickly spot unexpected data points and generate statistical summaries of data structures. (Figure 1.)
Figure 1: Allinea DDT debugger running 128 processes.
(Click graphic to zoom by 1.9x)
|
|
Another valuable time-saving feature of advanced debuggers is their ability to automatically record debugging sessions, with comments, directly into online logbooks. This feature enables developers to exactly repeat the same test setup to eliminate transcription errors or omissions. Debuggers can log variables and events in the background without affecting system timing. This enables the system to collect data for however long it takes for the problem to occur. This capability can be invaluable for catching seemingly random, nonrepeatable bugs. When integrated with common version-control tools, debuggers can highlight any recently changed code to help pinpoint any new errors.
One challenge for HPEC developers is that solving problems spanning multiple processors is much more difficult than working with serially executed code. That’s why, for HPEC system development, the debugger being used must have the ability to debug and control threads and processes, both individually and collectively. This type of debugger enables the creation of groups of processes based on variable or expression values, current code location, or process state. It also enables the developer to set breakpoints, step, and play individual or predefined groups of threads. In addition, parallel stacks can be displayed, providing a scalable view of all the stacks of every process and thread. This narrows down problems for any level of concurrency, from a handful of processes and threads to the entire system.
With these tools, finding and fixing deadlocks, live locks, race conditions, message synchronization, and other unexpected problems becomes much less daunting for the developer. One concern, though, is that if the debugger requires too much overhead to deliver all the desired advanced features, the system’s timing can be negatively affected. To avoid that penalty, the debugger being used must be able to work interactively with many processes within certain time constraints.
Map it!
A rough rule of thumb for system development is that an application will spend 60 to 70 percent of the time performing computations and 10 to 20 percent handling communications. A profiler, such as Allinea’s MAP, can point to computation and communication imbalances, including those performance issues caused by MPI or pthread synchronization issues. (Figure 2.) Profilers also perform equally well in finding and solving memory and I/O bottlenecks, which can otherwise cause developers some frustrating late nights in the lab.
Figure 2: MAP profiler pinpoints code-optimization opportunities.
(Click graphic to zoom by 1.9x)
|
|

Sometimes, even if the application code is up and running, it might not be meeting the timeline or may require some fine tuning to optimize performance. The conventional approach at this juncture is to insert timers into the code, run the code, analyze the results, and then change the code. This process might be followed by any number of iterations until results are satisfactory. Part of the problem is that by simply inserting and then removing a timer, errors can be easily and inadvertently introduced into the code. Using a profiler enables code to be compiled without having to be instrumented, and eliminates the need to record arcane compilation settings as well.
Bringing HPC development tools to COTS HPEC
Leveraging the expansive, mature ecosystem of development tools used in the commercial HPC development community, with its vastly larger installed user base, provides HPEC system developers with proven, full-featured tools that embrace a system-level perspective. Instead of focusing on individual boards in the chassis, a higher-level approach is much more effective for setting up HPEC systems, maintaining them, and partitioning code across multiple nodes. To simplify the process of transferring proven HPC tools into the COTS HPEC environment, Curtiss-Wright has introduced the OpenHPEC Accelerator Suite. It features Bright Computing’s cluster manager and Allinea Software’s debugger and profiler solutions, brought over directly from the HPC domain. The tool suite supports 40 GB Ethernet, InfiniBand, and PCIe Gen 1/2/3 fabrics, as well as multiple versions of MPI for communications. This integrated HPEC development environment is tested, validated, and benchmarked. (Figure 3.)
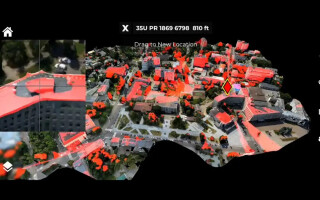
Figure 3: Example of a 3U OpenVPX HPEC system.
(Click graphic to zoom by 1.9x)
|
|

The right tools
As the demand for larger-scale, higher-performance deployed HPEC systems increases, access to the best development tools will only become more critical. By leveraging tools such as debuggers, profilers, and cluster managers – tools that are already matured and proven in the commercial supercomputer market – HPEC system developers will derive significant productivity advantages that lower costs and cut development schedules. Even better, these tools provide a superior alternative to expensive proprietary options.
Tammy Carter is the senior product manager for OpenHPEC products for Curtiss-Wright Defense Solutions, based out of Ashburn, Virginia. She has more than 20 years of experience in designing, developing, and integrating real-time embedded systems in the defense, communications, and medical arenas. She holds a Master of Science in Computer Science from the University of Central Florida. Readers may reach the author at tcarter@curtisswright.com.
Curtiss-Wright www.curtisswrightds.com